Local inference field note / September 2026
The fastest local-LLM upgrade was remembering
Retesting Qwen3.8-27B on a 64GB M4 Max: the headline optimization did nothing, the most flattering metric pointed in the wrong direction, and an SSD cache cut a 91-second wait to 1.09 seconds.
- 1.09s
- SSD-restored continuation, down from 90.93s cold
- 83×
- less waiting by skipping repeated prefill
- 102
- ordinary text-agent calls checked in the field
On this page
The short answer
The largest speedup I found did not make the model generate faster. It stopped the model from repeating work it had already done.
Local-model tuning tends to orbit tokens per second: a new quant, a better drafter, a wider speculative block, another processor to offload work onto. Those numbers are easy to compare and satisfying to improve. But the delay I noticed most in daily use was elsewhere. I would return to an older Hermes conversation and wait a minute or more before the first new token appeared. The model was not decoding slowly. It was rebuilding a long prompt it had already processed.
Once oMLX's DFlash SSD prefix cache was working, a continuation of a 21,700-token conversation came back in 1.09 seconds instead of roughly 91 seconds. That was the only result in this round of tuning that immediately changed how the machine felt. It was also not the experiment I expected to win.
The system has three layers: Hermes manages the agent and its conversations, oMLX serves the model, and DFlash drafts tokens for Qwen3.8-27B to verify. “Prefill” is the work of reading the existing conversation before the model can generate the next token.
What changed
The practical answer is small: keep the model, drafter, context limit, and draft block that were already working. Enable SSD prefix restoration, trial low reasoning for the foreground agent, and leave ANE prefill off after its failures in long visual sessions.
| Setting | Result |
|---|---|
| Main model | Qwen3.8-27B MLX 4-bit ↗ |
| Drafter | Qwen3.8-27B-DFlash2 ↗ |
| DFlash maximum context | 98,304 tokens |
| Draft block size | 5 — unchanged |
| DFlash SSD prefix cache | Enabled, 20GiB limit |
| ANE prefill | Disabled after repeated VLM/Metal failures |
| Hermes main agent | Low reasoning effort, on trial |
| Hermes subagents | Medium reasoning effort |
| Vision recovery | Manual reload; watchdog under field testing |
Three findings support those choices. First, preserving completed prompt work removed far more waiting than accelerating it. Second, lower reasoning reached useful answers sooner by producing fewer hidden tokens. Third, the most attractive proxy metrics—ANE benchmark gains and draft acceptance—did not improve this system in ordinary use.
Why these choices survived
The fastest prompt is the one you do not process again
The in-memory DFlash prefix cache held four entries. That was enough for active conversations but not for the way I use Hermes across multiple sessions. Once an older session was evicted, returning to it meant reconstructing the entire prompt—about a minute and a half at 20K tokens, and potentially several minutes at larger contexts. oMLX 0.6.4 had added SSD-backed DFlash snapshots, but my configuration left them disabled.
My first test appeared to miss the cache because I resent the original prompt. A snapshot contains the prompt and its generated answer; lookup is designed for a continuation extending that stored prefix. Testing a real continuation changed the result.
| Path | Time to first token |
|---|---|
| Cold processing, roughly 21.7K-token prompt | 90.93s |
| Continuation restored from memory | 0.79s |
| Continuation restored from SSD after eviction | 1.09s |

Runtime counters confirmed the SSD hit: 21,697 of 21,722 prompt tokens were restored. The meaningful comparison is not 0.79 seconds in memory versus 1.09 seconds on SSD—both are excellent—but 1.09 seconds versus 90.93 seconds after the memory entry is gone. The cache stayed enabled because it removes repeated work instead of merely making that work faster.
What the benchmark looked like in daily use
The controlled cache test was deliberately simple. Hermes is not. A normal turn can involve web searches, terminal calls, images, growing tool output, and context compression. I therefore checked the next stretch of ordinary use rather than assuming the 1.09-second result would describe every continuation.
Swipe to compare columns →
| Field path | Calls | Median prompt | Prefix reused | Median prefill | Median request |
|---|---|---|---|---|---|
| No reusable prefix | 14 | 29.0K | 0% | 121.57s | 140.94s |
| Prefix reused | 88 | 34.2K | 98.2% | 3.92s | 19.28s |
These were not identical prompts, so the request-time ratio is descriptive rather than a controlled speedup. The cleanest adjacent pair makes the mechanism clearer. A 30,515-token call with no reusable prefix spent 132.16 seconds in prefill. Its immediate continuation restored 30,510 of 30,659 prompt tokens and spent 1.15 seconds there.
Generation itself did not explain the experience. Across the larger trace, median decode throughput was 27.85 tok/s without a prefix and 27.45 tok/s with one; median draft acceptance was 67.9% and 70.25%. The large change was the work skipped before generation.
The visual workflow showed the same shape on a different engine. In seven VLM sessions, the first completion took a median 130.01 seconds; 32 later completions took a median 32.12 seconds. That is descriptive, not a controlled 4× speedup: outputs, tool payloads, and warm state all varied. In one lunch-photo loop, the first 41.7K-token call took 136.37 seconds; two immediate follow-ups finished in 25.53 and 18.59 seconds. Real agent loops were messier than the benchmark, but they supported the same conclusion: preserving history mattered more than squeezing a few more tokens per second from generation.
Less reasoning, not less capability
Qwen3.8's highest reasoning setting can spend a startling amount of time before producing an answer. The research suggestedmedium and proposed that shorter reasoning might also be easier for DFlash2 to predict. The experiment rejected that mechanism while making the cost of xhigh hard to ignore. “First answer” means the moment hidden reasoning ended and the final response began. “Total” includes the whole completion, so differently sized final answers can make it move in the opposite direction.
Swipe to compare columns →
| Effort | Task | First answer | Total | Reasoning characters |
|---|---|---|---|---|
| xhigh | Code | No usable answer before token cap | 609.8s | 94,453 |
| xhigh | Prose | 379.8s | 404.3s | 54,602 |
| medium | Code | 32.5s | 175.3s | 6,935 |
| medium | Prose | 45.8s | 65.1s | 7,150 |
| low | Code | 21.7s | 184.9s | 4,456 |
| low | Prose | 4.9s | 38.2s | 759 |
The original xhigh code measurement overlapped another request, so I discarded it and repeated the prompt on an idle server. The clean run took 609.8 seconds, emitted 94,453 characters of reasoning, and exhausted a 24,576-token budget without producing the requested module. Prose independently showed the same tendency, waiting almost 380 seconds before its response began.
Across the sweep, however, DFlash acceptance remained in roughly the same 70–77% range. Low reasoning did not unlock a hidden speculative-decoding speedup. It reached the final answer sooner by generating far fewer reasoning tokens. This was not a clean win on every total-runtime number: the low-effort code completion ran longer than medium after its answer began.
Speed was only half the decision. Claude generated shuffled low-versus-medium pairs for TypeScript, prose, and a health-coaching conversation similar to my daily Hermes use. I preferred low on the health task, called the prose a tie, and found the TypeScript implementations comparable. Both TypeScript modules passed a fourteen-case differential test.
That is not enough evidence to declare low universally equal to medium. It is enough to run the main agent at low on trial for the workload I actually care about. Subagents remain at medium because their thinking is usually off the foreground critical path and these comparisons say little about longer tool-using loops. Low helps by doing less work before answering, not by making DFlash predict better.
A better-looking metric made the system slower
DFlash2 proposes several future tokens, and the full model accepts the valid prefix. It is tempting to optimize the acceptance percentage directly: more accepted tokens must mean more speed.
My draft block size was 5. Community results suggested trying 8 and 16. Both larger settings raised acceptance on the code prompt from 77.1% to 83.6%. They still lost.
Swipe to compare columns →
| Draft block | Code generation | Prose generation | Acceptance, code / prose |
|---|---|---|---|
| 5 — kept | 53.5–53.8 tok/s | 35.2–38.4 tok/s | 77.1% / 65.0% |
| 8 | 52.2–52.4 tok/s | 25.6–26.0 tok/s | 83.6% / 66.2% |
| 16 | 52.4–52.5 tok/s | 25.6–26.0 tok/s | 83.6% / 66.2% |
Code slowed slightly. Prose slowed by roughly 28%. Blocks 8 and 16 produced essentially identical results, suggesting that an effective limit elsewhere made them behave the same.
Acceptance is a ratio. Throughput is the objective. Drafting farther ahead can increase the fraction accepted while also spending more time proposing and verifying tokens that never become useful output. Block size 5 stayed.

The 57% optimization that did nothing
The most exciting community result was ANE prefill. oMLX can move part of Qwen's prompt-processing work from the GPU to Apple's Neural Engine. A published M3 Max test reported only 4% at 4K context, 13% at 16K, and 57% at 32K. My cold-prefill waits were the worst remaining latency in the stack, and the setting was off.
ANE off: 48.02 seconds. ANE on: 48.07 seconds. The difference was measurement noise.
The explanation was structural rather than statistical. In oMLX 0.6.4, the Qwen ANE patch is wired into the standard vision-capable, or VLM, engine. The DFlash engine loads its target through a different path and never enables the ANE prefill implementation. The setting was accepted, stored, and displayed, but silently did no work on the engine I actually use. Nothing crashed and the flag looked correct; only an engagement log or counter exposed the miss.
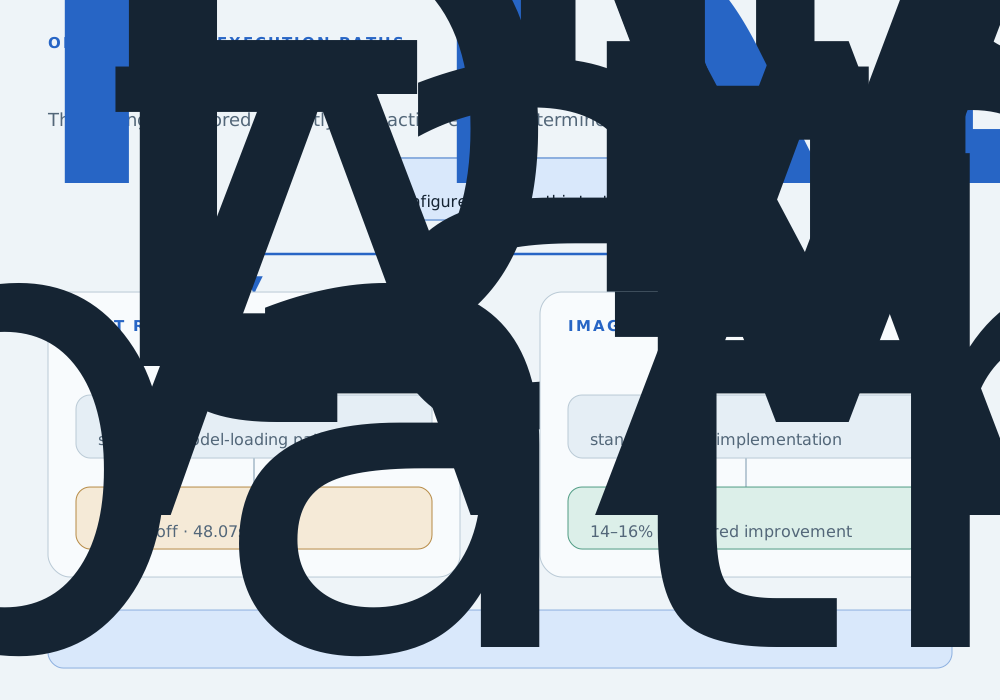
To measure the ANE implementation itself, I temporarily disabled DFlash and ran the VLM engine with the feature off and on.
Swipe to compare columns →
| Prompt size, off / on | ANE off | ANE on | Throughput gain |
|---|---|---|---|
| 10,965 / 10,927 | 44.06s | 38.09s | +15.7% |
| 21,632 / 21,692 | 90.77s | 77.94s | +16.5% |
| 64,661 / 64,591 | 322.42s | 281.94s | +14.4% |
The Neural Engine helped, but by 14–16% on this M4 Max, not 57%. The original 32K result was measured on a thermally soaked M3 Max and attributed part of its gain to relieving GPU thermal pressure. It was a valid result for that machine and protocol, not a portable constant.
Giving up DFlash to obtain the smaller prefill improvement would be a bad trade. I initially kept ANE for image requests, which force the model onto the VLM path, but two long-context visual turns ended in persistent Metal command-buffer errors inside ANE prefill. A measured speedup was not worth keeping on an unstable path, so I disabled it.
Operational caveat: recovery after an image
One operational problem remained from the original setup. When the DFlash engine receives an image, oMLX switches the model to its ordinary vision-capable engine. The switch is expected; DFlash cannot serve that multimodal turn. The surprising behavior is that the model can remain on the slower VLM engine for later text-only requests until it is unloaded and reloaded.
One screenshot can therefore cut subsequent generation speed roughly in half without producing an error. Manual reload remains the only recovery I consider dependable.
A possible watchdog could probe an idle model and check whetherspeculation.totals.requests increased; the VLM fallback does not increment that counter. It is a promising detection signal, not a finished safeguard. I would want substantially more ordinary visual use, recovery observations, and false-positive testing before recommending an automatic reload.
How I tested the choices
The system under test
My daily local agent runs on a Mac Studio with an M4 Max and 64GB of unified memory. The model is the regular mlx-community/Qwen3.8-27B-4bit ↗ checkpoint, served by oMLX 0.6.4 ↗, with incoai/Qwen3.8-27B-DFlash2 ↗ proposing future tokens for the full model to verify. Hermes Agent sits in front of it and handles conversations, tools, reminders, delegation, compression, and the rest of the application layer.
The first round of work had already settled the broad architecture:
- 4-bit weights left enough memory for useful context and the drafter.
- DFlash2 raised clean generation from roughly 23–25 tok/s without speculation to as much as 44–54 tok/s, depending on the output.
- Hermes used a 65,536-token working context and compressed before reaching DFlash's 98,304-token ceiling.
- Thinking was disabled for auxiliary work such as title generation and context compression, where it added cost without helping the result.
- The in-memory DFlash prefix cache retained four entries within an 8GiB limit.
In real Hermes sessions, generation usually landed around 25–29 tok/s. A controlled code-generation prompt could reach 53.8 tok/s with 77.1% of drafted tokens accepted. Prose was slower, around 35–38 tok/s with 65% acceptance. Cold prompt processing remained the expensive phase: tens of thousands of tokens could take minutes before generation began. That was the question for this round.
Turning community advice into hypotheses
I asked Claude Code to research what the community had learned about Qwen3.8-27B since my original setup. The report returned a plausible list of opportunities:
- Enable Apple Neural Engine prefill. One M3 Max report ↗ showed a 57% improvement at 32K context.
- Reduce the model's reasoning effort from its expensive
xhighdefault. - Enable the DFlash SSD prefix cache added in recent oMLX releases.
- Try larger DFlash draft blocks.
- Explore recovery from oMLX's persistent switch to the slower vision-capable engine ↗ after an image request.
The largest claim came from different hardware, engine, and checkpoint, so I treated the report as a queue of experiments rather than a configuration guide. Each test changed one variable and measured the mechanism it should affect; the harness rejected any result whose log window contained an overlapping request.
Baseline first
Before changing anything, I repeated a code task, a prose task, and a cold-prefill ladder.
Swipe to compare columns →
| Workload | Generation | Draft acceptance |
|---|---|---|
| Code | 53.5–53.8 tok/s | 77.1% |
| Prose | 35.2–38.4 tok/s | 65.0% |
The acceptance rates repeated to the decimal. Cold prompt processing declined from about 229 tok/s at 10.9K tokens to 204 tok/s at 43.2K, and five planted facts survived every tested length. The baseline was stable enough to challenge. It also showed why one tokens-per-second number cannot describe a model: structured code was much easier for the drafter to predict than open-ended prose.
Sources and reproducibility
The measurements, raw harness output, blind-comparison artifacts, and watchdog code were retained with the experiment. The public references below cover the model, drafter, runtime release, and the community reports that became testable hypotheses.
- Part one: Tuning Qwen3.8-27B for Hermes on a 64GB M4 Max ↗
- MLX Community Qwen3.8-27B 4-bit ↗
- Qwen3.8-27B DFlash2 drafter ↗
- oMLX 0.6.4 release ↗
- oMLX DFlash/VLM fallback issue ↗
- oMLX ANE prefill benchmarks on M3 Max ↗
- mlx-dspark drafter cross-benchmark ↗
- Simon Willison on Qwen3.8’s reasoning default ↗
The first xhigh code run is intentionally absent from the table because a scheduled request overlapped it. The clean idle-server rerun is the reported 609.8-second result.
Measured on a 64GB M4 Max using Qwen3.8-27B MLX 4-bit, DFlash2, and oMLX 0.6.4. Controlled tests and the Hermes field trace are labeled separately so synthetic repeatability is not confused with daily-use variability.